An overall evaluation of the SFSRTS program in 2021-23 and evaluation plans for the future of the program under SFPS can be found within the final SFSRTS Action Plan for 2024-2027. For a review of activities and accomplishments in 2022, see Santa Fe SRTS Progress Report for 2022. For a review of activities and accomplishments in 2021, see Santa Fe SRTS Progress Report for 2021.
SFSRTS staff and consultants took formal tallies of student arrivals and departures, using nationally-developed Student Travel Tally forms linked below, in visits to sixteen local schools between September 2021 and December 2023. As indicated in the graph and table below, roughly eight six percent reported arriving by non-motorized means on the day of the visit, including 6.5% walking, 1.5% bicycling, and 0.1% by scooter or skateboard. Nearly 80% of students arrived by their own family’s private vehicle and 13.5% arrived by school bus.
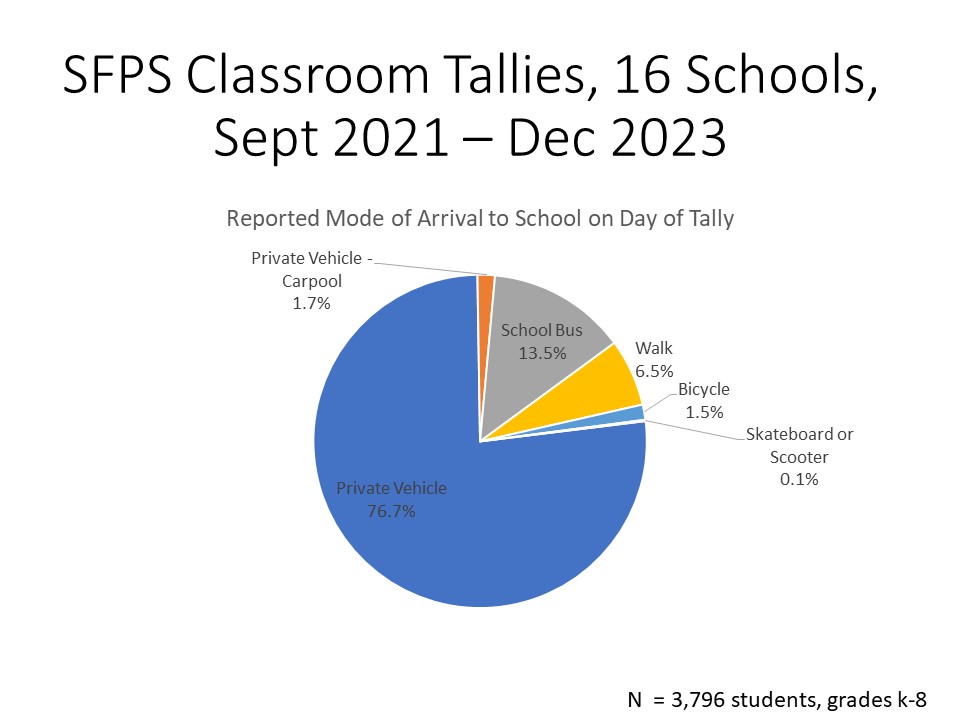
The complete findings on reported mode of arrival, including breakdowns by school, are as follows:
| School | Number of Counts | # am arrival | Walk | Bike | Other | Bus | Private Vehicle | Carpool |
| Acequia Madre | 7 | 127 | 14.2% | 4.7% | 0.0% | 0.8% | 80.3% | 0.0% |
| Amy Biehl | 10 | 173 | 1.7% | 1.2% | 0.0% | 27.7% | 69.4% | 0.0% |
| Aspen | 8 | 149 | 5.4% | 1.3% | 0.0% | 14.1% | 79.9% | 0.7% |
| Carlos Gilbert | 2 | 42 | 4.8% | 0.0% | 0.0% | 0.0% | 69.0% | 26.2% |
| Cesar Chavez | 5 | 228 | 2.6% | 0.0% | 0.0% | 21.9% | 74.1% | 1.3% |
| Chaparral* | 3 | 82 | 11.0% | 2.4% | 0.0% | 19.5% | 59.8% | 7.3% |
| ECRA | 22 | 439 | 13.0% | 1.4% | 0.0% | 9.3% | 76.3% | 0.0% |
| Kearny | 14 | 246 | 7.7% | 2.8% | 0.0% | 17.1% | 71.5% | 1.2% |
| Milagro | 12 | 237 | 4.2% | 1.3% | 0.0% | 18.1% | 76.8% | 0.4% |
| Nina Otero | 20 | 393 | 3.8% | 0.8% | 0.3% | 16.0% | 75.8% | 3.1% |
| Ortiz | 9 | 164 | 6.1% | 1.8% | 0.6% | 17.7% | 70.7% | 3.0% |
| Pinon | 17 | 300 | 3.7% | 1.3% | 0.0% | 10.7% | 79.0% | 5.3% |
| Ramirez Thomas | 34 | 640 | 5.5% | 0.5% | 0.0% | 9.5% | 84.4% | 0.2% |
| Salazar | 11 | 217 | 9.2% | 2.8% | 0.0% | 12.4% | 74.2% | 1.4% |
| Sweeney | 8 | 204 | 3.4% | 0.0% | 0.0% | 15.2% | 81.4% | 0.5% |
| Wood Gormley* | 8 | 155 | 11.6% | 5.8% | 1.9% | 5.2% | 74.8% | 0.6% |
| Total | 190 | 3796 | 6.5% | 1.5% | 0.1% | 13.5% | 76.8% | 1.7% |
* Small samples including tallies on Walk to School Day.
The following table focuses on walking, bicycling, and skating or scooting as a percentage of the total. Note that the highest proportions of non-motorized travel relate to school with skewed or very small sample sizes (as provided in table above).
| Total Non-Motorized (Walk + Bike + Other) | ||||||||||||||||||||||||||||||||||||||||||
| School | W + B + Other | |||||||||||||||||||||||||||||||||||||||||
| Wood Gormley* | 19.4% | |||||||||||||||||||||||||||||||||||||||||
| Acequia Madre | 18.9% | |||||||||||||||||||||||||||||||||||||||||
| ECRA | 14.4% | |||||||||||||||||||||||||||||||||||||||||
| Chaparral* | 13.4% | |||||||||||||||||||||||||||||||||||||||||
| Salazar | 12.0% | |||||||||||||||||||||||||||||||||||||||||
| Kearny | 10.6% | |||||||||||||||||||||||||||||||||||||||||
| Ortiz | 8.5% | |||||||||||||||||||||||||||||||||||||||||
| Aspen | 6.7% | |||||||||||||||||||||||||||||||||||||||||
| Ramirez Thomas | 5.9% | |||||||||||||||||||||||||||||||||||||||||
| Milagro | 5.5% | |||||||||||||||||||||||||||||||||||||||||
| Pinon | 5.0% | |||||||||||||||||||||||||||||||||||||||||
| Nina Otero | 4.8% | |||||||||||||||||||||||||||||||||||||||||
| Carlos Gilbert | 4.8% | |||||||||||||||||||||||||||||||||||||||||
| Sweeney | 3.4% | |||||||||||||||||||||||||||||||||||||||||
| Amy Biehl | 2.9% | |||||||||||||||||||||||||||||||||||||||||
| Cesar Chavez | 2.6% | |||||||||||||||||||||||||||||||||||||||||
| Total | 8.1% | |||||||||||||||||||||||||||||||||||||||||
* Small samples including tallies on Walk to School Day.
Pedestrian and Bicycle Information Center (PBIC) Safe Routes to School Evaluation Forms:
The SFSRTS Program has adapted the PBIC Parent Survey with locally significant questions added, in Spanish and English, particularly to solicit families’ involvement in our program activities. The new survey was tried out at three “Fix-It Fiestas” held in April 2022 in English-only paper forms, and piloted by Ortiz Middle School as a bilingual electronic survey in 2023.